Understanding Break-Even in Your Child Care Business

Understanding Break-Even
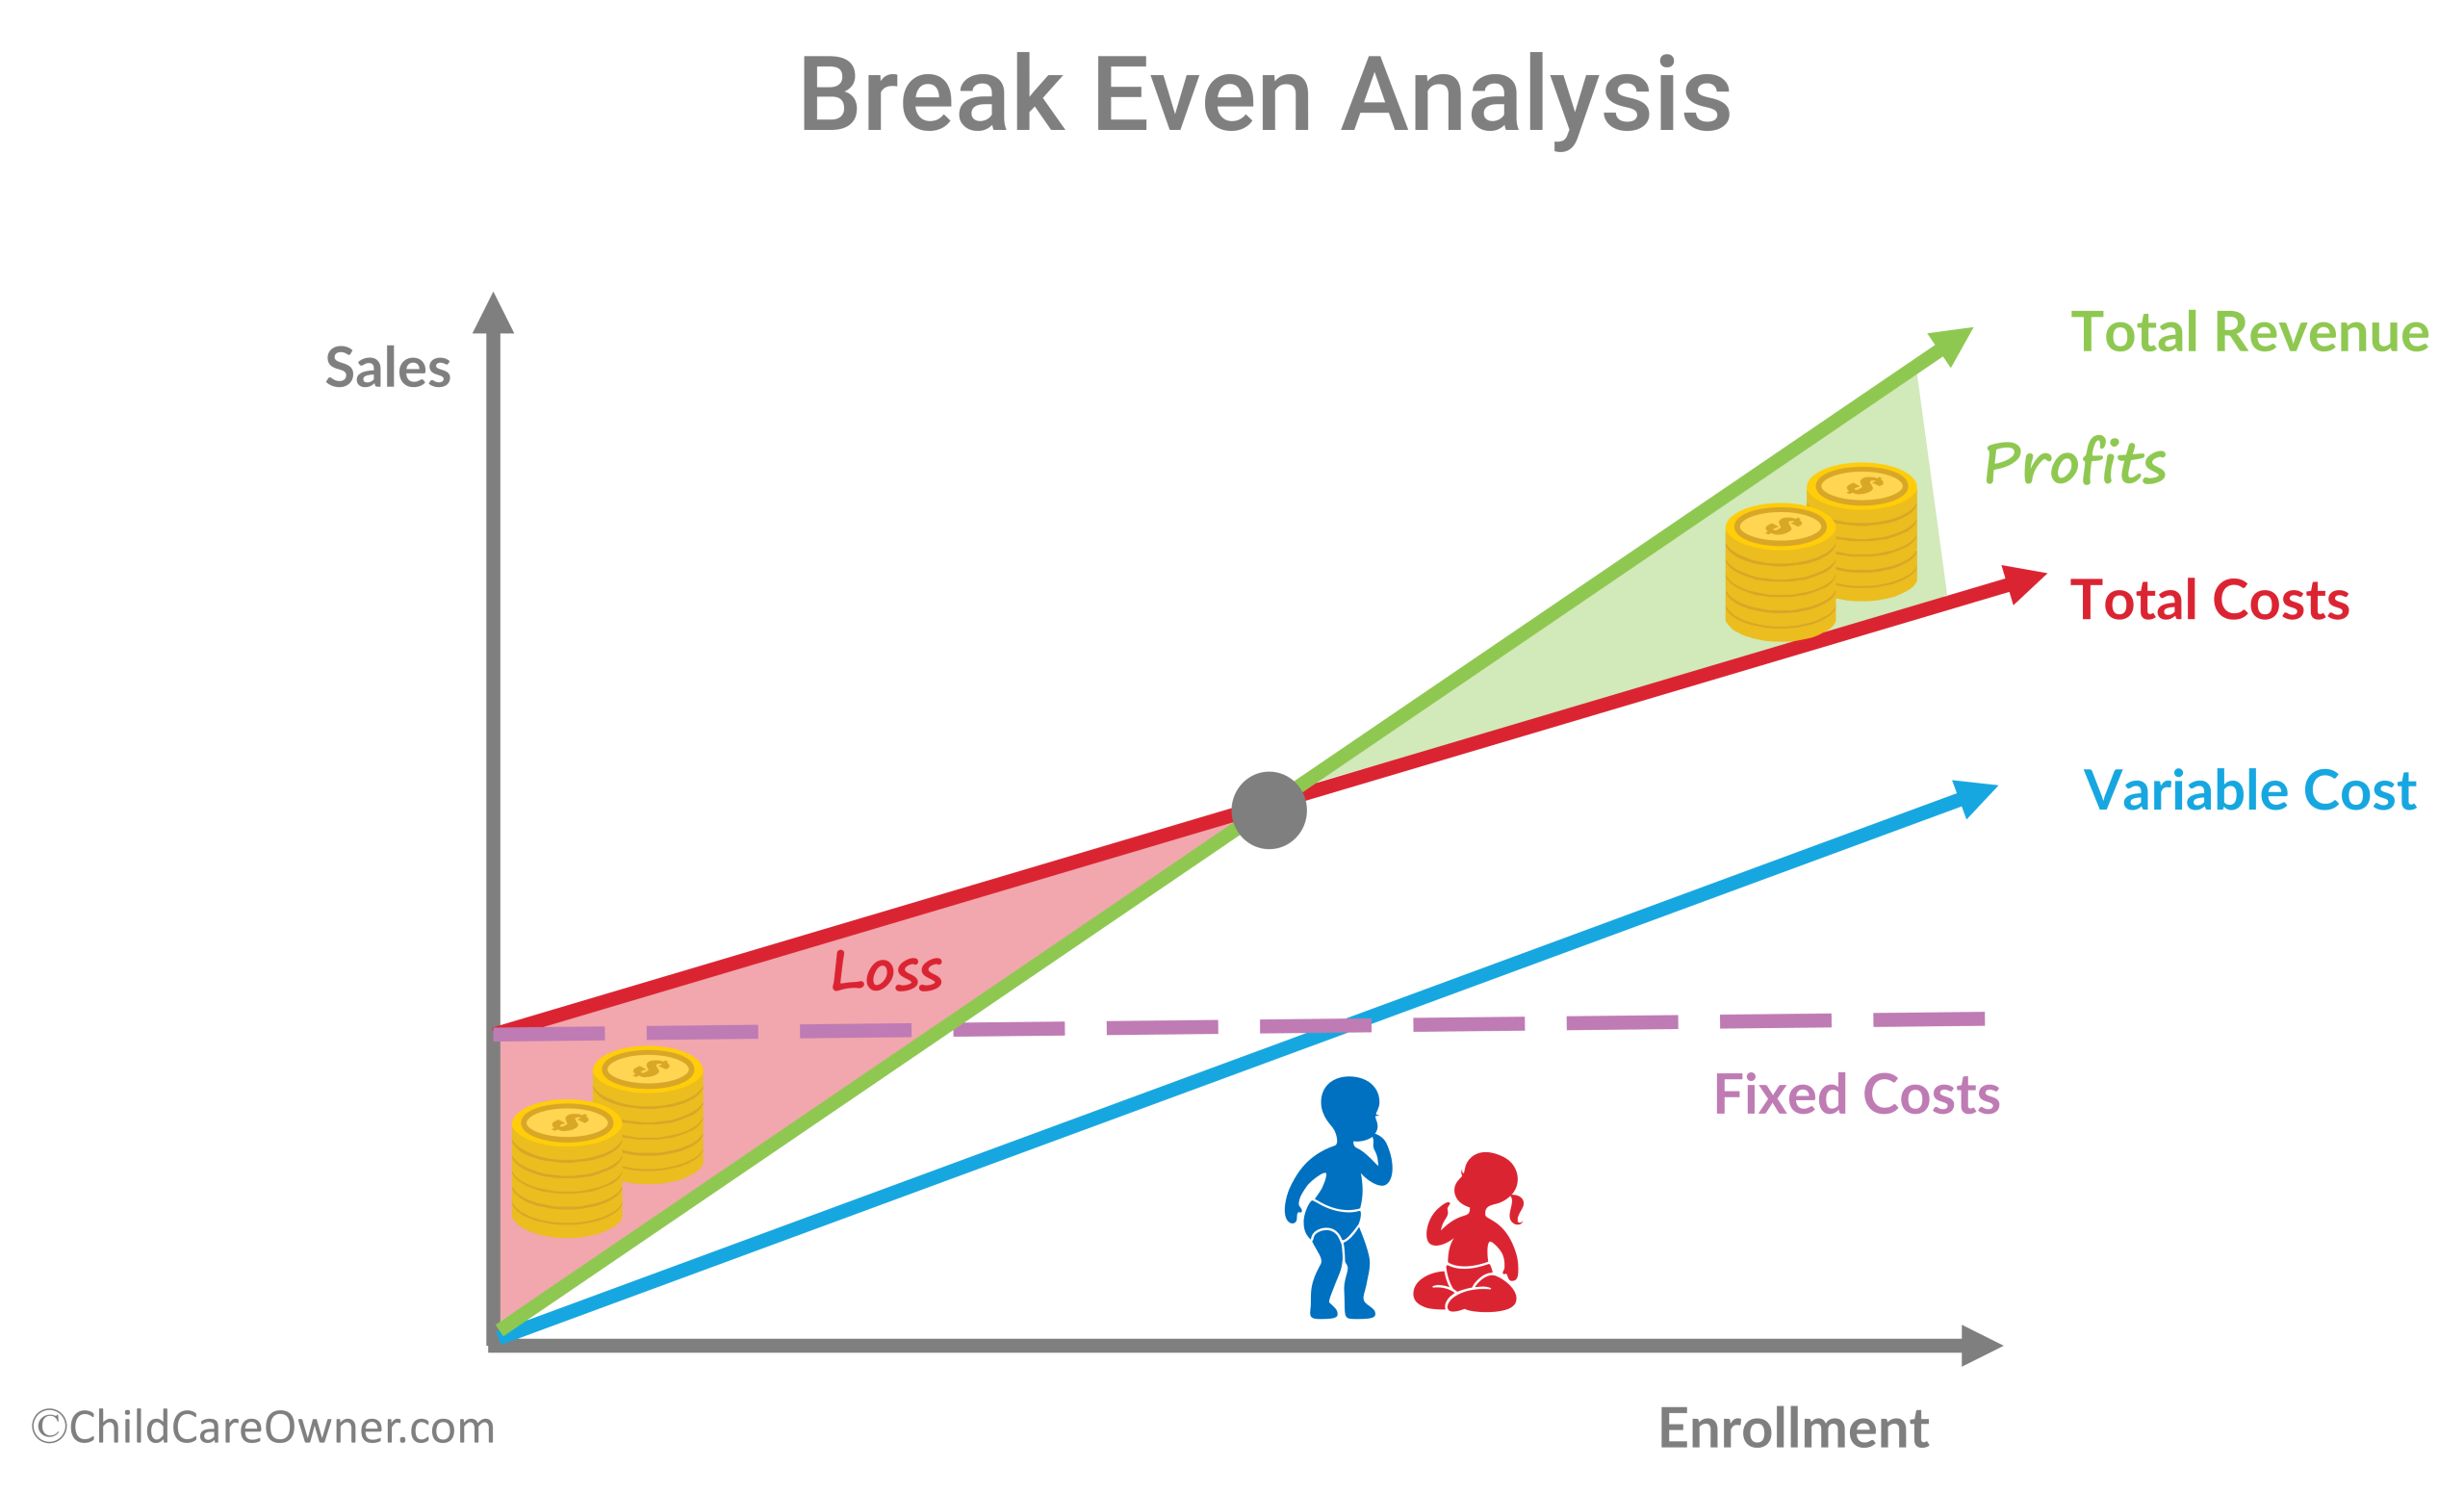
Break-even is the minimal amount of income/revenue a child care center must earn to cover all expenses without losing money or making money. Therefore, all income above the break-even point would be profits.
To calculate your center’s break-even, add up all of the operating expenses for a month, i.e. labor, supplies, rent, insurance, etc. The total expense number should be divided by 4.33 to determine a weekly break-even.
Example: All operating expenses for one month = $50,000 (monthly break-even)
$ 50,000 (operating expenses) = $ 11,547 (weekly break-even)
4.33 (weekly)
You would also want to calculate the enrollment needed to break-even. For example, if your average weekly rate is $ 100.00 x 4.33 = $ 433.00 monthly
$ 50,000 (operating expenses) = 115.47 break-even enrollment
$ 433.00 (monthly average rate)
In order to break-even, your daily enrollment would need to be approximately 116 children. With an enrollment of 116 you would not lose money, but you would not make a profit. Of course, the goal of a business is to make a profit. The break-even point is a variable number and can increase and decrease based on operating expenses. You should calculate your break-even at least once every quarter. Knowing your break-even can assist you with:
- Determining your rate schedule
- Making adjustments to labor based on enrollment
- Decreasing expenses to lower the break-even point
- Increasing enrollment to reach the break-even point and above to make a profit